Thursday, July 20, 2006

The Teaching Company

The Teaching company commissions top collage professors to prepare great courses that they publish on DVD, VHS, CD, Audiotape, Audio file and printed format. The courses are grouped in 9 categories; Business and Economics, Fine Arts and Music, History - Ancient and Medieval, History - Modern, Literature & English Language, Philosophy & Intellectual History, religion, Science and Mathematics, and Social Sciences. Every course goes on sale at least once a year and advertised in The Economist magazine or at their web site. You can also check your local library for these great courses that I strongly recommend.

Tuesday, July 18, 2006

Document Icons

Document Icons is a software designed by Amber Frid-Jimenez that generates graphical shapes to allow the user to search intuitively through content of millions of text documents by using histograms. The program creates a shape which becomes the documents profile showing concept areas within the document.
It basically works like this: It starts with a histogram of words which is the graph of occurrence frequency. These are then grouped around major concepts that you see in red and wrapped around a point. In the example below the words on the border of the circle are the most used words. The occurrence of words are depicted by the gray area. The 3 red words at three corners are the major concepts. The shape of the gray area gives the user a comprehension of what the document is about and how much it emphasizes the selected concepts. This results in quick profiling of the document.
In this other graph you can see how multiple documents can be compared at a glance.

Monday, July 17, 2006

Alice

Object theory created a paradigm shift in programming and since early 1990s it has been the mainstream programming technique. Alice is a free Program Visualization Tool from Carnegie Mellon University to help young students learn some of the main concepts of OOP like class, object, method, inheritance, encapsulation, abstraction and polymorphism. It is a very visual, 3D interactive animation environment and makes learning OO programming as simple as building Lego. Simple, effective, fun and great if you want to introduce your kid to programming.

Sunday, July 16, 2006

Xcelsius

I have been using Xcelsius for a few years. It is a great tool to visualize data from Microsoft Excel. Colorful, dynamic dashboards can be created in no time from underlying excel tables. Great for interactive presentations, documentation and web publishing. Recently they have been bought by Business Objects which develops Crystal Reports. This acquisition makes a lot of sense to me.

TreePad

I am always in search of products to assist me in my consulting profession. I deal with large amount of data and information. Data capture, analyses, visualization and presentation techniques and tools create a great deal of interest in me. One of the needs I identified was a tool to help me capture and categorize information in a hierarchical manner. I tried a few custom Excel and VBA based solutions but then found about Treepad. As its name suggests, it is a combination of a Windows Explorer type hierarchical presentation layer and and a notepad type information capture area for each of the nodes in the tree. It has many features which you can read in their web site but the one I liked most is the ability to generate a website from the Treepad content. This tool became one of my favorite "tools of the trade".

Saturday, July 15, 2006

Professional Lego Builders

Creative minds and thousands of small Danish plastic pieces give Eric Harshbarger and Nathan Sawaya the title of Professional Lego builders. I guess they can claim that they have started their career literally at the age of 2. Well, that is a leverage that you don't get in most other professions.

Friday, July 14, 2006

Mind Mapping

In my consulting engagements, I always felt the need to use some sort of a tool to collect and categorize the results of the brainstorming sessions more effectively. I am a true supporter of paperless office so I have already eliminated paper from my work habits long time ago thanks to my ultralight and ultrafast IBM ThinkPad X40 which made electronic note taking no more hustle than pulling up a notepad and pen. I used to use Microsoft Word and also occasionally Excel as sometimes it is more convenient just to capture keywords and a spreadsheet provides advantages when it comes to categorizing or sorting. I moved on to Microsoft OneNote when Microsoft released it in 2003. It is a good product that I still use it when I have to capture large textual data. However the real solution to my problem was my discovery of the Mind Mapping technique.
Mind mapping is an analysis, problem solving and decision making technique that enables the organization, visualization and categorization of ideas through diagramming. A mind map starts with a central key word and then radiates to related items. It is a great tool for brainstorming and data collection and has been around since the 3rd century when the tinkers of the period graphically visualized ideas to categorize and relate them.
And of course, there are many software products that allows you to draw mind maps. The one I bought is the MindManager from MindJet. It has rich functionality with a clean and professional looking user interface, and provides perfect integration with Microsoft Office. This is what a Mind Map looks like:
It is easy to get addicted to mind mapping. I started to keep my to-lists, training notes, book summaries, brainstorming sessions, meeting notes, and design discussions in MindManager. This quickly became a tool I use daily.
There are a lot of experts of Mind Mapping technique out there like Chuck Frey who runs he Innovation Tools web site and The Mind Mapping Software Weblog both very rich and valuable resources. Another good site is the Mindtools.

PMWiki

I used to maintain an HTML based web site to keep track of my job related research. I wanted to have a personal portal where I publish the results of my research, my job related reference material, articles and a collection of links for my reference and easy access. However building and maintaining it was time consuming. When it got to the point that the productive time was less than the construction time, I decided to switch to a different technology. I started to look for alternatives. I tried Blogs but their chronological architecture did not fit my purpose. I looked at the Content Management Applications but their heavy footprint and proprietary architecture were not appealing. I wanted a simple, lightweight, and open platform. Than one day I saw an article in the PC Magazine article about Wikis.
I knew about Wiki as I am a heavy user of Wikipedia. I trust Wikipedia so much that on most occasions, I search items first in Wikipedia then Google it. So I thought of using a wiki engine before but never got to it. The PC Magazine article excited me so I gave it a shot. I just didn't know how easy it would be to install and operate it. I selected PMWiki because of its text based repository, simplicity and small footprint. It requires Apache and PHP but don't worry if you have no experience in either as there are packages that includes Apache, PHP and even MySQL like EasyPHP which is very easy to install. But if you will deploy it to a hosted environment and just want a local test environment, PMWiki actually comes with a tiny web server so you do not need anything. The whole package is less then 8MB with all the documentation which you can delete and It works instantly.
I deployed my company web site on PMWiki and use it like an online notebook from anywhere, building a knowledge portal on matters about IT Architecture. It is not public yet as I need to shape it up a little and sort out the security issues.

Thursday, July 13, 2006

Moral Intelligence

How do you teach your kid the essential virtues to build a solid character? Mine has just turned 3, and to my suprise, he immediately he started to ask questions about the good and the the bad. What an interesting sign of the emergence of reasoning and coinscience. Welcome to the pursuit of justice son. I wonder if this is the ultimate purpose of life? While observing him grow, sometimes I feel like I am actually learning more about life then he does. What an amazing experience. I remember reading somewhere that the four stages of awareness are:
  • Unconscious Incompetence : You do not know what you do not know. Total ignorance. You basically have no idea about that is going on at this stage.
  • Conscious Incompetence: You know what you do not know. This is actually not a bad place to be, considering most of the people, regarding most of the issues are not even here. Awareness is a good start.
  • Conscious competence: At this point, you have already learned alot. But you still need to think before answering. And the theory is solid but not that rock solid. Every now and then you need to go back and think or read more about it.
  • Unconscious Competence: What you know is now obvious and and natural to you. You would not even understand why you did not know in the first place. This is the stage of true mastership.

This actually just reminded me Richard Bach's Jonathan Livingston Seagull that I studied in my English class some 20 years ago. I guess there is some similarity of thought there.

Anyway, these are not from the book that I wanted to mention which is Michele Borba's "Building Moral Intelligence". This is the best I was able to find after going through a dozen of similar books. She elaborates on seven essential virtues; Empathy, Conscience, Self-Control, Respect, Kindness, Tolerance, and Fairness.
As Heraclitus said "Character is destiny". The scary part is that, in most cases whe destiny at stake is not only the individual's own destiny. Actually with the amount of power and influence a single person can get hold of, one soul can define the destiny of a whole lot of people. What an aweful responsibility.

The Best Statistical Graphic

French engineer, Charles Minard's (1781-1870) illustration of Napoleon's failed Russian campaign of 1812 is considered the best statistical graphic ever drawn by most experts. It is clean and informative. The graph is actually drawn on the map which automatically conveys the geographic information.
The maps starts at the left on the Polish-Russian border near the Niemen and streches to Moscow on the right edge. The size of the army is represented by the width of the band across the map of the campaign on its outward and return legs, with temperature and timeline shown on the line graph at the bottom. The army of 422,000 men is reduced to 100,000 when it reached Moscow. The path of Napoleon's retreat from Moscow in the cold winter is depicted by the dark lower band, which is tied to temperature and time scales. Only 10,000 managed to survive the campaign. Minard's graphic tells a rich story with a clean and simple diagram that plots 6 variables: the size of the army, its location, direction of the movement, temperature and dates. You can click on the image to enlarge it.

They Rule

Another beautiful example of information visualization and ingenious user interface design. Clean, minimal, and efficient interface of theyrule.net is an impressive work both content and technology wise. Information is being presented very effectively.
They Rule aims to provide information on the relationships of the US corporate board members. You can select any two companies and the application will graphically find a link between these two companies through the board members who usually work for many companies at once. You can click on an individual and initiate a search on a search engine of your choice. You can annotate a map by adding notes, save, load and email maps.

A Visual Home Valuation Tool

I am facinated with information visualization practices as with maps and GPS technology. Here is an interesting application of all these. Zillow is providing information on housing prices in US, superimposed on a satalite or a street map. So convenient. Other services I have seen give the same information in a text / tabular format. If real estate is all about location, location, location, reflecting the financial data on a geographical baseline sounds like two birds with one stone to me.

Visual Thesaurus

While researching my current favorite subject "Information Visualization", I came across an innovative product called the "
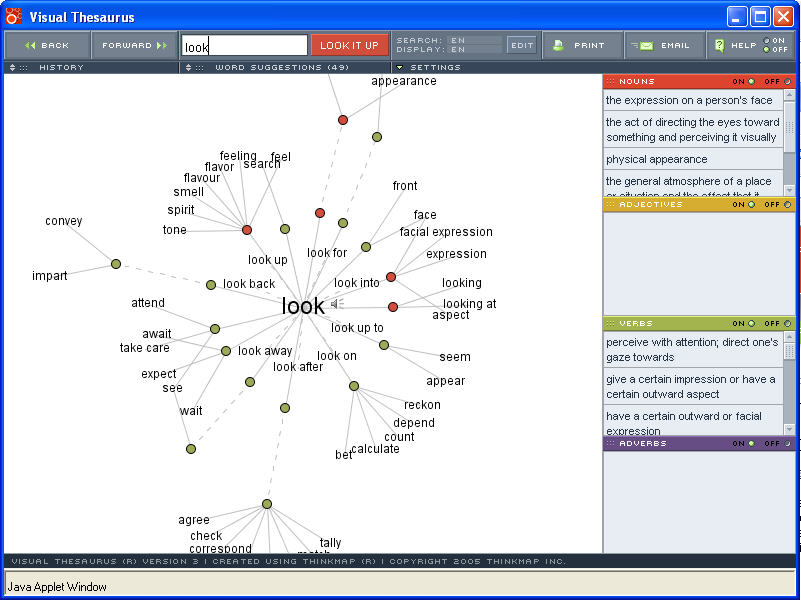
Visual Thesaurus".

It is an interactive dictionary and thesaurus which creates a visual map of a word and all the meanings, synonyms and antonym of it. The meanings are color coded to categorize them as nouns, adjectives, verbs or adverbs. You can roll your mouse over a word to learn its meaning or listen to the pronunciation of it. I signed up for the online version of it so it loads a small Java applet and the interface is beautiful and functional. Every time you click on a new node, the graphic smoothly re-adjusts by positioning the new item in the center of the screen and new relations are displayed. The image optimizes itself to make the diagram as much readable as possible by avoiding test and graphic element collusions. That algorithm should be interesting.
I strongly believe we will see this kind of data representation more and more as there is clearly a need for a next generation method of presenting information. There is too much information out there but not many technologies that will enable us to make more sense of it. We need to better organize, classify and relate data by representing it visually better to allow us to get to it faster and to be able to make more sense of it.
I just typed "Visual" in google and it returned 972.000.000 results. I do not know how this information is useful to anybody and what that means. I believe Google should stop displaying the result counters. To me it brings no value. I believe most people just browse the first few pages or re-submit their search to narrow down the results. Having said that Google is doing a terrific job of bringing the most relevant entries together with clearly marked sponsored results so I never have any problems with finding information as long as I am specific enough in my queries.
Well.. My point is it is time they take it to the next level. Wouldn't it be terrific if they had an optional 3d graphical results page where they aggregate the information, categorize it and display it as graphically associated objects so that you can navigate by clicking on these objects and drill down on your queries and then switch to text mode when needed? I am sure with all the genius people on board, they should be considering this kind of technology.

While thinking about these I came across an other fine example; 
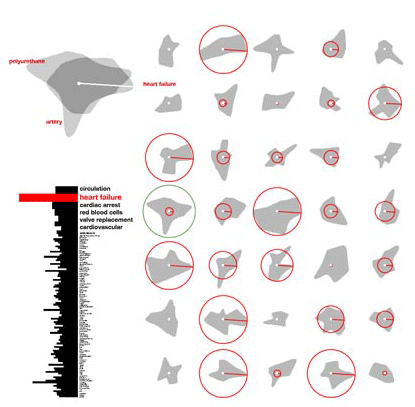
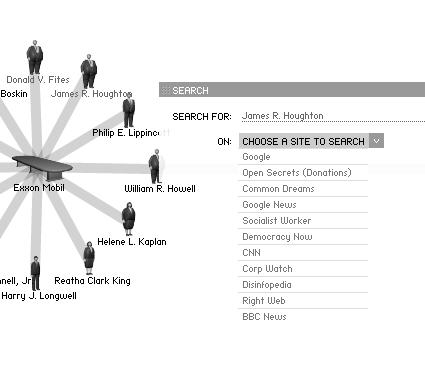
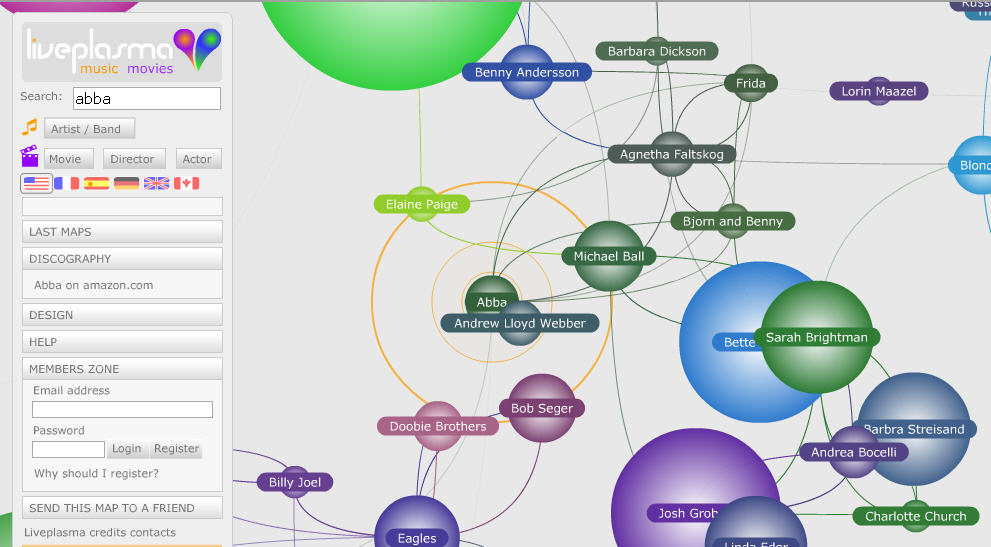
Liveplasma. A different kind of search service where the searched item is displayed in the middle of the map with related items around it. The proximity of the items provide information on the relationship. The larger the ring around the name, the more important it is. Plus it is all color coded so you can immediately understand the category of the items. You can click on an other item on the map and that becomes the focal point and the map is re-drawn.

I believe this kind of information representation adds great value. Human brain is much more receptive to graphical information. Plus in most cases the information is multi-dimentional meaning you need to convey multiple types of information which you can not do by character based systems. So you need at least color coding to represent the categorization. We need to start treating information as objects with properties and relationships just like the Object-Oriented Theory of Computer Science which I believe is one of the best inventions of our age.
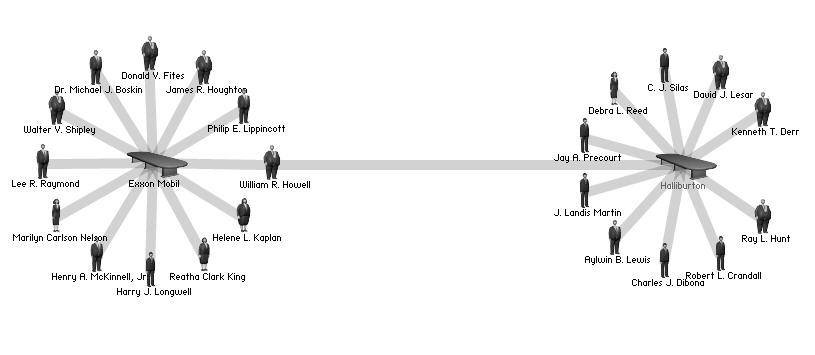
I keep updating this article as it seems there are more examples of this out there. This one is from 
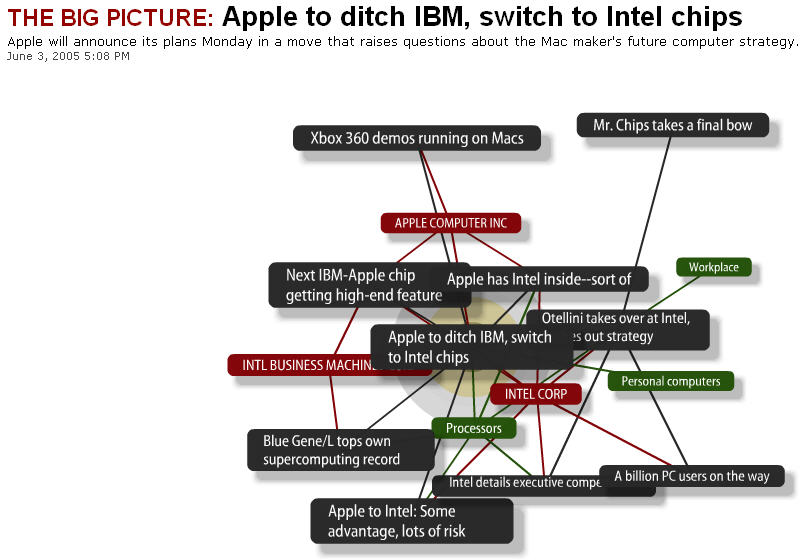
Cnet (Click on any news and it is on the right lower side). Under the news section they have what they called the "Big Picture". Great name. This is exactly what this technology is for. To give you the big picture. It seems they actually licensed the graphic engine from liveplasma.com which was referenced above and feed the IT industry news through it. So when you look up a news you see all the related news and other supplementary information about this. Check out the example that is in the picture below:

The black boxes are related stories, the green boxes are related topics and the red boxes are related companies. You can click on any other box and it moves into focus and the diagram is redrawn in a very smooth way and the new relationships are established. When you move your mouse on a box it drops down a small panel like a tool tip that gives you the choices to get more information on the topic. I wonder the algorithm behind the process that establishes the relationships. As opposed top the "Visual Thesaurus" example where these relations has to be defined by humans, this CNet example should be using an automated process to create the relations based on keywords.
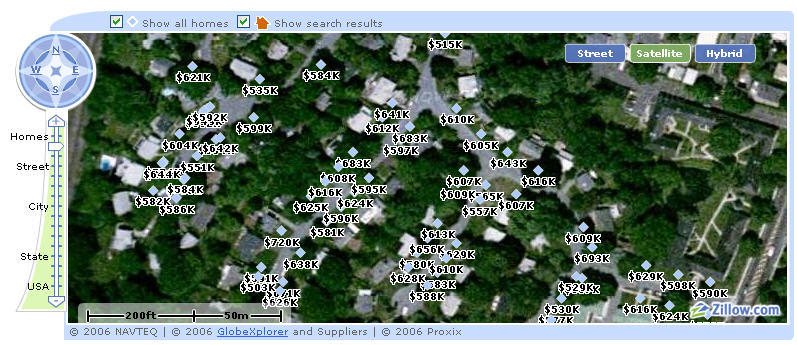
Cnet also has an other visual tool under "What is hot" category. This time they use space-filling visualization method. This works by dividing the display area into a nested sequence of rectangles whose areas correspond to an attribute of the data set, effectively combining aspects of a Venn diagram and a pie chart. Originally designed to visualize files on a hard drive, this technology have been applied to a wide variety of domains ranging from financial analysis to sports reporting. There should be complex algorithms behind this kind of diagramming to reduce the occurrence of high aspect ratio rectangles and to maintain ordering.